
Lab 1 Getting to know your cropping system
Lab 1 Getting to know your cropping system
When we are managing a piece of land, it is important to take a comprehensive approach. We want to be aware of the natural resources surrounding us, so that we can capitalize on the strengths of the natural landscape and protect the areas surrounding our field.
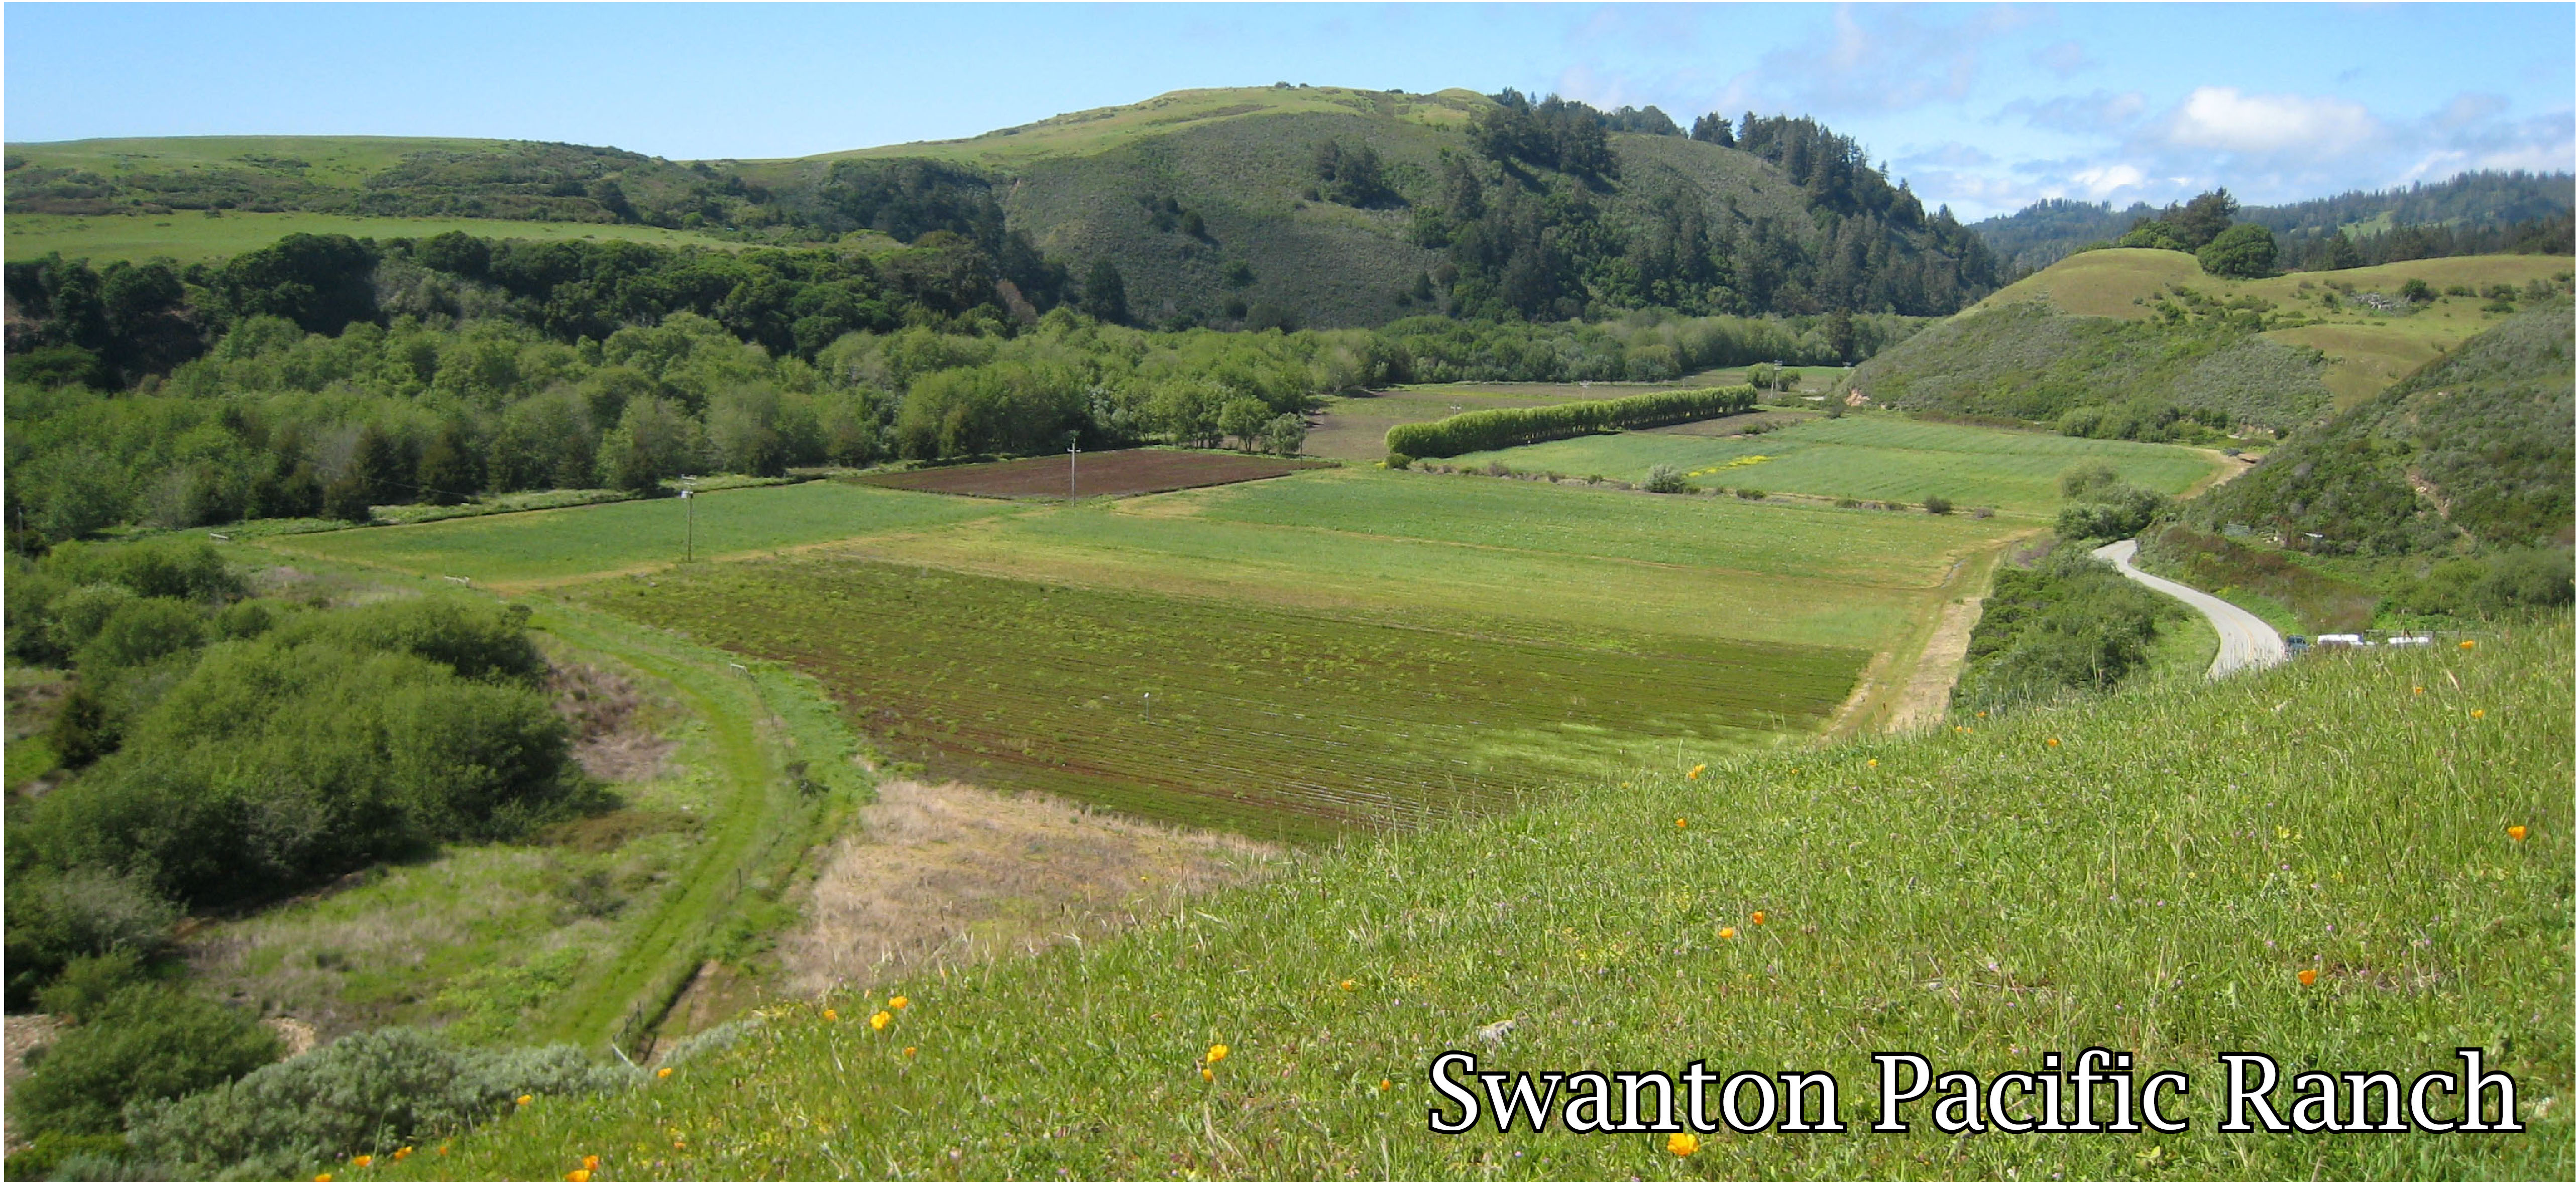
A great example of what to pay attention to in the landscape surrounding our field is captured very well in the carbon farm plan for Cal Poly's Swanton Pacific ranch. In the first 20 pages of the plan, the authors describe the location of the ranch, the history of the ranch, the topography, the land use and vegetation, the hydrology, and the soil types. Understanding these factors can help you make much more informed decisions on your current land use management.
Ok, let's have a look at the context of the cropping system we are studying in this lab!
The first step is to just visit the field location. If you cannot make it in person, you can get a sense of your surroundings by using google earth. Navigate to the following coordinates to zoom in on the Cal Poly lemon orchard:
35°17'52.38"N; 120°40'14.32"W
Navigate to https://www.google.com/earth/. We will use the desktop version of Google Earth. Go to earth versions and click on Google Earth Pro on desktop. Follow the steps to download google earth pro. Open google earth pro on your computer. For each of the field sites, enter the coordinates in the search box. Use the 3D feature to explore the surrounding landscape.
Cool! Not the same as the real deal, but it gives an idea. Now, we will look at some things we wouldn't see out in the field. We will travel through time! In Google Earth Pro on your computer, go to view and click 'historical imagery'. A time line will pop up, and you can scroll through the historic images.
The time traveling feature in Google Earth Pro is very exciting for those of us who are nostalgic about the past. But, it has some real interesting relevance to soil health and fertility management. Land use history can have important impacts on soil properties, and having a better insight into a field's land-use history can often help trouble shoot challenges in the field or explain patterns in nutrient or yield variability. Note how many US Agencies contributed to collecting this great database of satellite images. Thank you US Farm Service Agency, USGS, NASA, and many others!
- Describe the setting of the field site. What does the surrounding landscape look like. What is the current land use and vegetation type? Are there any water bodies or sensitive areas nearby?
- Now, let's take a look at the land use history. Do you see any changes in the land-use in the last 3 decades? Do you spot any potential disturbances that could impact soil health? Focus on the Cal Poly lemon orchard as well as the areas immediately surrounding the field.
Next, let's see what soils we find in our field. Much of this course will focus on the information we can find on a standard soil test report provided by agricultural soil testing labs. These reports mostly includes dynamic soil properties that change with management. However, we know that there are many soil properties that are a result of soil formation, a process that leaves its impact on geological time scales. Examples are soil texture, soil depth, diagnostic soil horizons, and soil mineralogy. These soil properties are considered inherent soil properties, and will not change with management. These inherent soil properties determine to a great extent, however, how we can use a certain field and how we decide to manage it.
Where can we find information on these inherent soil properties? Remember when you learned about soil classification in SS 121/120. The web soil survey allows you to look up the soil type in a specific location. Knowing the soil type will give you an insight into the importance of different soil forming factors in this location and provide information on the suitability of this soil for a variety of uses. Alternatively, you can use the UC Davis SoilWeb. Both tools are based on the same datasets to a great extent, but vary in their presentation and capabilities. We will explore what we can learn about our soil in each of these tools.
Web Soil Survey
To use the web soil survey, go to the NRCS Web Soil Survey Homepage. Click the 'START WSS' button, and the web soil survey application will open in the next tab.
Selecting your area of interest
Under the Area of Interest (AOI) tab, enter the coordinates of your field. Select the area of interest using the AOI tool. Choose and area that does not only capture the lemon orchard but also portions of the surrounding fields.
Why is it important to look at the broader picture frame than just zooming in on the lemon orchard alone? Well, let's answer this question with another question. How did mappers and surveyors know where to draw the lines between soil types? The Natural Resources Conservation Service has dug thousands of soil pits to characterize soil all over the united states. The mappers will use the information from individual soil pits and use other maps on geology and vegetation types, satellite images, and other tools to the estimate where one soil type ends and another starts. Of course, these estimations are a best guess, a prediction. In the real landscapes, these transitions between soil types may be gradual or abrupt, and may be somewhat shifted relative to the mapping units. Therefore, knowing the soil types in the surrounding area could help understand your field conditions better. In addition, taking the bigger frame into your area of interest gives you an idea of the variability in soil types surrounding your field.
Exploring properties and characteristics of your soil
You will know you have selected your area of interest correctly, when you see turquoise lines shading your area. Once you have identified and selected your area of interest, go to the soil map tab. Look up the soil type in the area the soil was collected. What are some other dominant soil series surrounding the field?
Next, go to the soil data explorer. In the suitabilities and limitations for use, you can find the land capabilities. Land capabilities include rating systems for the suitability of land for various agricultural uses. Click on the farmland classification and view that rating.
Under land classifications, you will also find the soil taxonomy classification. The ratings under soil taxonomy classification will give you the proper taxonomic name of your soil series of interest. What can you do with this information? If you remember SS 121/120, you will know that there is a lot in the name of a soil. The soil order gives us some clues about the formation of this soil and general characteristics. The great group and subgroup indicate potential special features like duripans or fragipans. These are important to spot, because they can impede root growth and water movement. The family can give us information about the specific clay mineralogy, which is relevant for understanding soil properties such as soil texture, cation exchange capacity and water holding capacity. If you are not sure what all the nomenclature in a soils taxonomic name means, you can consult the Keys to Soil Taxonomy.
The web soil survey is an incredible resource that contains a lot of information about soils across the united states. You need to be careful, though, that some of the properties provided in the web soil survey, such as pH, EC, sodium adsorption ratio, soil organic matter, and bulk density can change with management. These properties are only interesting to look at in the web soil survey when you are dealing with natural ecosystem. And even then, the values may not be representative. The most valuable information on the web soil survey is the information related to inherent soil properties such as soil depth and soil texture. To investigate these properties, go to the 'Soil properties and qualities' tab. With respect to soil fertility management, we will look at the following properties:
Chemical properties:
Calcium carbonate: Calcium carbonate (CaCO3) equivalent is the percent of carbonates, by weight, in the fraction of the soil less than 2 millimeters in size. The availability of plant nutrients is influenced by the amount of carbonates in the soil. Many nutrients can precipitate with calcium or carbonate. When a soil is high in calcium carbonates, acidification can release Ca and make it plant available.
CEC-7: Cation-exchange capacity (CEC-7) is the total amount of extractable cations that can be held by the soil, expressed in terms of milliequivalents per 100 grams of soil at neutrality (pH 7.0) or at some other stated pH value. Soils having a low cation-exchange capacity hold fewer cations and may require more frequent applications of fertilizer than soils having a high cation-exchange capacity. The ability to retain cations reduces the hazard of ground-water pollution.
Gypsum: The content of gypsum is the percent, by weight, of hydrated calcium sulfates (CaSO4) in the fraction of the soil less than 20 millimeters in size. Gypsum is partially soluble in water. Gypsum contains the plant essential nutrients Ca and S. Solubilization of some of the gypsum in a soil can contribute to plant nutrition.
Physical properties:
- Available water capacity: Available water capacity (AWC) refers to the quantity of water that the soil is capable of storing for use by plants. The capacity for water storage is given in centimeters of water per centimeter of soil for each soil layer. The main determining soil property for AWC is soil texture and the presence of rock fragments. From there, the AWC is modified by the content of organic matter, bulk density, and soil structure, with corrections for salinity.
- Saturated hydraulic conductivity (Ksat): Ksat represents the ease and speed with which water moves through the soil. The estimates are expressed in terms of micrometers per second. They are based on soil characteristics observed in the field, particularly texture. Management practices that affect structure and porosity can alter Ksat.
- Surface structure: This displays the representative texture class of the surface horizon.
Soil qualities and features
- Depth to selected restrictive layer: A "restrictive layer" is a nearly continuous layer that has one or more physical, chemical, or thermal properties that significantly impede the movement of water and air through the soil or that restrict roots or otherwise provide an unfavorable root environment. Examples are bedrock, cemented layers, dense layers, and frozen layers. In this feature, you can identify the depth to an abrupt textural change, lithic bedrock, or paralithic bedrock.
- Drainage class: "Drainage class (natural)" refers to the frequency and duration of wet periods under conditions similar to those under which the soil formed. Alterations of the water regime by human activities, either through drainage or irrigation, are not a consideration unless they have significantly changed the morphology of the soil. Seven classes of natural soil drainage are recognized-excessively drained, somewhat excessively drained, well drained, moderately well drained, somewhat poorly drained, poorly drained, and very poorly drained. Installation of tile drains could be considered in poorly drained soils.
- Parent material name: Parent material name is a term for the general physical, chemical, and mineralogical composition of the unconsolidated material, mineral or organic, in which the soil forms. Mode of deposition and/or weathering may be implied by the name.
Water features
- Depth to water table: "Water table" refers to a saturated zone in the soil. It occurs during specified months. Estimates of the upper limit are based mainly on observations of the water table at selected sites and on evidence of a saturated zone, namely grayish colors (redoximorphic features) in the soil. A saturated zone that lasts for less than a month is not considered a water table.
Finally, we may want to assess some vulnerability risks for our soil. Three vulnerability risks that are very relevant to soil health and fertility management are erosion, runoff, and susceptibility to compaction.
- Erosion caused by wind: Select this property from Soil properties and qualities -> Soil erosion factors -> wind erodibility group. A wind erodibility group (WEG) consists of soils that have similar properties affecting their susceptibility to wind erosion in cultivated areas. The soils assigned to group 1 are the most susceptible to wind erosion, and those assigned to group 8 are the least susceptible.
- Erosion caused by water: Erosion factor K indicates the susceptibility of a soil to sheet and rill erosion by water. Values of K range from 0.02 to 0.69. Other factors being equal, the higher the value, the more susceptible the soil is to sheet and rill erosion by water.
- Susceptibility to compaction: Go to suitabilities and and limitations for use > Soil health > Soil susceptibility to compaction. Soils are rated based on their susceptibility to compaction from the operation of ground-based equipment for planting, harvesting, and site preparation activities when soils are moist. Soil compaction is the process in which soil particles are pressed together more closely that in the original state. Typically, the soil must be moist to be compacted because the mineral grains must slide together.
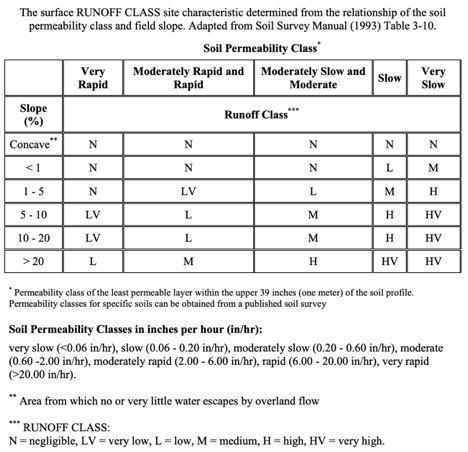
- Runoff class: Go to soil map -> click on the soil series of interest. The runoff class is listed in the soil description that pops up. Runoff class is determined based on soil permeability and slope. High runoff could pause several environmental issues.
- Use the web soil survey to explore the soils in and surrounding our field site. List the soil type in the lemon orchard, and list the soil types surrounding this field.
- What is the full taxonomic name of the soil type in the lemon orchard?
- What is the soil order for the soil in the lemon orchard? How did you know and what do you remember about this soil order?
- What is the farmland classification for this soil?
- What is the rating for the chemical properties calcium carbonate in the top 3 feet, CEC-7 in the topsoil, and gypsum in the top 3 feet.
- In your own word, explain why CEC, calcium carbonates, and gypsum are relevant for plant nutrition? Based on this info, what do the ratings in the lemon orchard mean for lemon production at this site?
- What is the rating for the physical properties AWC in the top 3 feet of soil, Ksat in the top 3 feet of soil, and surface texture? Include units in your answer.
- In your own words, explain the importance of AWC, Ksat and surface texture, and discuss what it means with regard to lemon production. For AWC, calculate how many inches of water can be held in the top 3 feet of soil. For Ksat, compare Ksat in this field to Ksat in surrounding soil types.
- What is the rating for the qualities and features depth to restrictive layer, drainage class, and parent material name? Do you think these characteristics are suitable for lemon growth? Why?
- What are the ratings for the risks of erosion caused by water and wind, runoff, and susceptibility to compaction. What are implications for growing lemons on this field site?
The Web Soil Survey contains a lot of great information, but some of the delivery is may not be so convenient to navigate. For example, it provides info on the soil horizons, but the data is not so easy to visualize and access. A very nice conceptual visualization of the soil horizons and soil properties by depth is available in the UC Davis SoilWeb.
To access the UC Davis SoilWeb on your desktop,
- Go to https://casoilresource.lawr.ucdavis.edu/gmap/
- Go to menu -> zoom to location -> enter coordinates and hit go.
- Double click on the area of the map you are interested in. The map unit composition will pop up.
- If you click on the soil series you are interested in, the soil profile sketch will pop up.
- You can click through the different soil properties, to see how they vary by depth.
You can also install a mobile version of the application on your phone, which allows you to easily access soil survey information out in the field.
Access soil data in the field
SoilWeb allows you to look up information on the spot. When you open the app, click on the "Get Soil Data" button. The app will pull up a visual of the soil profile in your location. Visualizing the soil profile can help us understand our soil in just a few seconds.
Key inherent soil properties relevant to crop production
Next to the profile, you will see buttons for many of the key inherent soil properties relevant to crop production. You will find Ksat, the Kf factor (relevant in predicting erosion by water), CaCO3, gypsum, and CEC. You can prefer to the previous stimulus to learn more about what these variables mean.
In addition, you will find information on the soil taxonomy, land classification, hydraulic and erosion ratings, and soil suitability ratings.
- List all the soil horizons and their corresponding depth increments.
- Use your basic soil science knowledge to interpret implications of the soil profile for crop production.
- What is the distribution of CaCO3 in the soil? What are implications for crop production in this field?
- What is the distribution of gypsum in the soil? What are implications for crop production in this field?
- What is the distribution of CEC in the soil? How do you explain that CEC changes with depth? What are implications for crop production in this field?
- What is the distribution of Ksat, % sand and % clay in the soil profile? What does this mean in terms of water movement in the soil?
- Assess the soil suitability ratings. Given the ratings for the location on the lemon orchards, discuss implications for land use competition.
- What is the total Plant Available water for this soil? Provide your answer in cm and inches. Compare your result with the result that was found based on the Web Soil Survey. Why is it different?
- Read the information about Linear Ext. (Linear Extensibility Percent). In your own words, explain what the Linear Extensibility Percent means, and implications for crop production.
- Look at the complete soil series description. What is the use and vegetation and the distribution and extent of this soil?
The crop we will be working with in this lab is lemons. We will discuss a few aspects of citrus production in general, and highlight some specific characteristics of the Cal Poly lemon orchard.
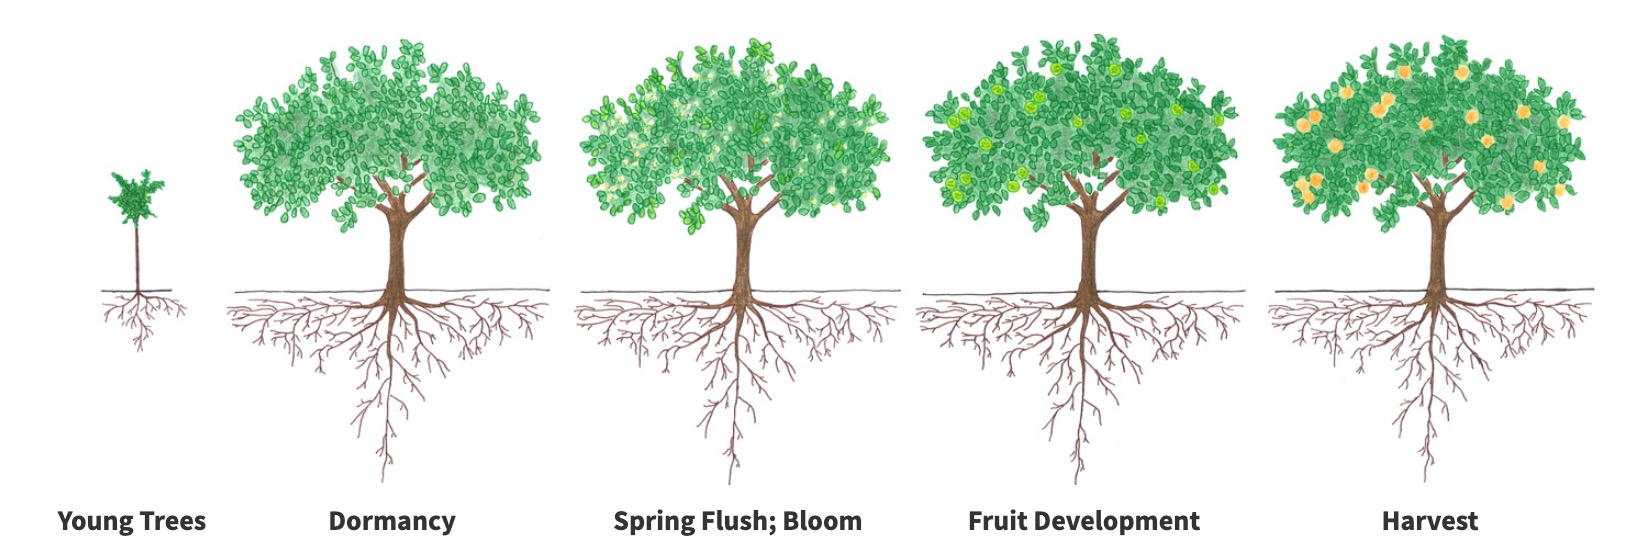
Image source: CDFA Fertilizer Guidelines
The typical citrus growth cycle in the northern hemisphere starts with dormancy during winter, spring flush and bloom, followed by fruit development and harvest in fall or winter. In the coastal regions of California, however, many citrus trees bloom year-round. Read in the blog post by the University of California Cooperative Extension in Ventura about implications of the behavior of the coastal citrus tree for fertilizer management.
- Provide the following details about the Cal Poly lemon orchard:
- Lemon variety
- Year planted
- Time of pruning
- Number of harvests per year
- What is the tree spacing in the Cal Poly lemon orchard? How many trees are there per acre? What are implications of the number of trees/acre and tree density for fertilizer management?
- Read the UCCE Ventura blog post and describe in your own words when citrus trees should be fertilized and why.