Lab 7 Micronutrients, leaf tissue testing, and soil test reports
Lab 7 Micronutrients, leaf tissue testing, and soil test reports
In labs 1-6, we used Soil Web and the Web Soil Survey to find out intrinsic properties of our soil; We have learned how to take a soil sample and how to assess soil health in the field; We have taken a close look into the importance of assessing soil pH and salinity, how to determine basic cations and why they matter; We have discussed how and why we measure soil organic matter, and studied methods for determining plant available nitrogen, phosphorus and sulfur.
Today, we augment this with a discussion on micronutrient deficiencies. In addition, you will put all your knowledge on soil properties and individual nutrient cycles together and apply the concepts you learned to interpret soil and tissue test reports.

Given the data we have collected for our soils in the lemon grove and results from a tissue test, we will assess the fertility and diagnose potential issues in the lemon orchard. This assignment will walk you through how to systematically interpret a soil test report, reiterating and synthesizing key concepts you have learned in labs 1-6. After interpreting the data for the soil and leaf tissue tests, you will make some general suggestions for soil health and fertility management.
Micronutrients learning objectives
- Understand the main constraints to the availability of micronutrients in soil
- Understand the role of chelates in increasing micronutrient availability in the soil and plant uptake
- Understand the method for analyzing potential soil bioavailability of Zn, Cu, Mn and Fe
- Learn how to interpret micronutrient results on a soil test report
- Investigate a micronutrient deficiency in a California case study
Availability of micronutrients and chelation
Micronutrients, although essential for good plant growth, are only required in small quantities. Despite the small quantities required, deficiencies can show up. Micronutrient deficiencies are very region and crop specific. However, some generalizations can be made:
- For many micronutrients, especially B and Cl, there is a fine line between toxicity and deficiency
- Micronutrients can easily become unavailable in the soil. If a micronutrient deficiency needs to be corrected, it is important to apply the micronutrients in way that will ensure uptake by the plant.
- There is generally less information for science-based decision making for micronutrients compared to N, P and K.
One way fertilizer industries formulate micronutrients to ensure plant availability is through the use of chelates. Learn more about how chelates work and why they are helpful in the video below.
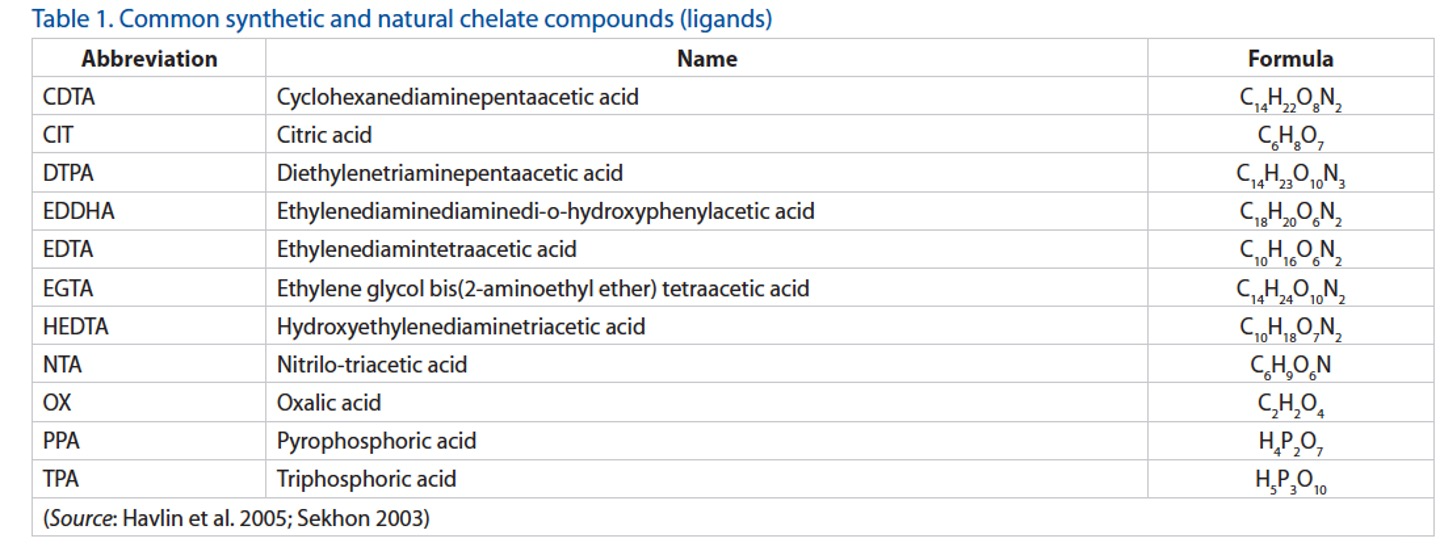
You might be surprised that high soil organic matter is listed in the video as an obstacle for micronutrient availability. Let's shed some light on this. Do you remember that soil organic matter is considered a colloid, because of its large and charged surface area? Well, micronutrients can be adsorbed onto colloids, including SOM, and become unavailable to the plant. However, you also want to remember that there are different pools of soil organic matter, each with different roles and behaviors in the soil? Some of that organic matter will be more active and soluble, and can chelate micronutrients and transport them to the plant roots much like the synthetic chelates in micronutrient fertilizer formulations (commonly EDTA and EDDHA). In fact, plants exude compounds like citric acid and oxalic acid, both of which are natural chelating agents. But then again, you might not be surprised that plants are way ahead of us.
Method for analyzing Zn, Cu, Mn and Fe
The DTPA (diethylenetriaminepentaacetic acid) micronutrient extraction method is the standard extraction procedure for estimating the potential soil availability of Zn, Cu, Mn, and Fe. After extraction, metal concentrations are quantified using inductively coupled plasma atomic emissions spectroscopy (ICP-AES). Note that DTPA is a chelating agents. So, chelates are used by plants to access micronutrients, by the fertilizer industry to increase plant availability of micronutrient fertilizers and by agronomists to determine micronutrient concentrations in the soil.
Boron and chloride can be determined as extractable boron and chloride ions, or based on a saturated paste. Extractable boron uses a hot water extraction, after which boron concentrations are quantified colorimetrically. Extractable boron is used to assess potential deficiencies of boron. It differs from the saturation paste soluble boron concentration which assesses possible toxic concentrations of soil boron. Extractable chloride uses a 0.1 M Ca(NO3)2 extraction, followed by colorimetric quantification upon complexation with mercury(II) thiocynate. Chloride may also be determined using ion specific electrode using 0.5M K2SO4 as the extractant. Extractable chloride data can be used to predict small grain responses to chloride additions. As for boron, quantification of chloride in saturated past extracts is meant to assess potential toxicity rather than deficiencies.
There are no reliable methods for determining molybdenum concentrations in soil. Molybdenum deficiencies are diagnosed based on plant tissue analysis. Nickel deficiencies are uncommon and nickel is typically not considered in soil or plant tissue tests.
Interpreting micronutrient results
Many micronutrient deficiencies are diagnosed based on tissue tests. However, especially in vegetable crops, reference values for micronutrient levels in soil are helpful. Such reference values have been documented by the University of California Cooperative extension, and are interpreted similarly to threshold values for P management. A great resource is "Soil Testing for Nutrient Availability Procedures and Interpretation for California Vegetable Crop Production" by Tim Hartz (2007). For crops, you are referred to local soil testing labs or local cooperative extension services.
Micronutrient deficiencies in a California case study
Because micronutrient deficiencies are so crop and region specific, a good place to learn about them is through the University of California Cooperative extension. Read the follow two blogs by Ben Faber, cooperative extension specialist in Ventura county.
- Blog post october 23, 2014: Zinc and Phosphorus
- Blog post May 2, 2017: Copper? On your avocado trees?
- List at least 4 reasons why micronutrient availability in the soil can be challenging
- In your own words, describe why chelates are used in micronutrient formulations
- Explain when to use boron and chloride data from saturated paste extracts vs. extractable boron and chloride concentrations
- Applying all the info included in this lab manual on micronutrients, propose 3 ways micronutrient deficiencies could be addressed by means other than applying micronutrient fertilizer.
A lot of information is contained in a soil test report. I urge you to systematically inspect your soil test report, going through the steps listed in the guidelines that follow. A systematic approach to assess soil test reports will help prevent overlooking important problems.
The first items you want to look at is the cation exchange capacity (CEC) and the soil organic matter content. These measurements will give you an idea of the general fertility potential of your soil.
Soils with a high CEC tend to be more fertile than soils with a low CEC, because they can better hold on to nutrients. Most CEC in the soil is related to the clay fraction. Soils with higher CEC are therefore typically finer textured soils.
Soil organic matter (SOM or OM) has many benefits for soil fertility. Soil organic matter contributes to aggregate formation and can help provide a better soil structure. This allows for better water and oxygen regulation in the soil, and promotes healthy root growth. Soil organic matter contains a lot of nutrients, that can become available to the plant after decomposition by microbes. Moreover, soil organic matter itself has a high CEC, as well as anion exchange capacity. In other words, soil organic matter can hold on to nutrients that occur in the soil as anions or negatively charged ions, and prevent them from being lost below the root zone. Soil organic matter also feeds a healthy soil food web, which is essential for efficient cycling of nutrients in the soil.
Secondly, you want to check if there are any problems with the soil. Is the pH in the range suitable for the crop you want to grow? If not, you will have to adjust the pH and retest the soil before developing your nutrient management plan. Other common problems are acidity and sodicity issues. Salinity is measured by electrical conductivity (EC). A value greater than 5 dS/m typically signifies a salinity problem, but some crops are more sensitive and show yield loss at values as low as 2 dS/m. Sodicity issues are assessed based on exchangeable sodium percentage (ESP) or sodium adsorption ratio (SAR). High sodium concentrations (ESP > 15, SAR > 13) are generally a reason to be concerned.
If you have established that your soil has no pH, salinity or sodicity problems, you can move on to evaluate the macro- and micronutrient levels in your soil. If lost from the soil through erosion, runoff or leaching, nitrogen (N) and phosphorus (P) can cause severe environmental problems. Therefore, high nitrogen and phosphorus levels are NOT a sign of a fertile soil, but a reason to be concerned about environmental pollution.
Some soils in and around San Luis Obispo are derived from serpentinite and have high Ca:Mg ratios. These ratios are calculated based on the Ca and Mg concentrations in meq/100 g of soil. In normal soils, Ca:Mg ratios are expected to be 10 or greater. If Mg concentrations are unusually high, Ca uptake can be decreased due to competition between Ca and Mg. There are no great guidelines on when Ca:Mg ratios are problematic, but a ratio of Ca:Mg < 1 is often considered reason to keep an eye on Ca deficiencies in the plant. Low Ca:Mg ratios can also lead to poor flocculation, because Mg cations are not as good as flocculating clay particles as Ca cations.
Finally, you can compare the levels of macro- and micronutrients in your soil to the nutrient requirements of your crops, and make an informed decision about which and how much nutrients you need to apply to ensure good crop growth. We will use reference values provided in the CDFA fertilizer guidelines and A&L laboratories (Local soil testing lab) for our interpretations. The CDFA fertilizer guidelines only focus on primary macronutrients. Crop specific recommendations for secondary macronutrients and micronutrients are available in bulletins from the UC Cooperative Extension for some crops. For example, Hartz et al. 2007 (University of California Cooperative Extension) provide a detailed account of macro- and micronutrient requirements for leafy greens.
Most soil test labs will ask the grower to indicate which crop is intended to be grown and provide a tailored fertilizer recommendation. The categorization of soil test results into high, medium or low nutrient levels by the lab is therefore mostly specific to the crop that was indicated to be grown.
Note that standard soil test reports only include soil chemical properties, while biological and physical soil properties may also have an important impact on crop yield. Efforts are underway to standardize testing procedures and interpretations for biological and physical properties. These will facilitate the development of more integrated soil management plans.
Here, I summarized data from the lemon orchard from soil collected in Spring 2020. Soil test results were adjusted for teaching purposes.
Table: Mock soil test Report, SS 221 Soil Health and Plant Nutrition, Cal Poly lemon orchard, Sampled Spring 2020
| Tree row | Tractor row | |
| SOC (%) | 1.78 | 2.25 |
| CEC (meq/100g soil) | 30 | 30 |
| NO3--N (ppm) | 2.4 | 20 |
| Olsen P (ppm) | 25 | 25 |
| K (ppm) | 385 | 364 |
| Ca (ppm) | 4239 | 4956 |
| Mg (ppm) | 969 | 674 |
| Na (ppm) | 49 | 53 |
| Cu (ppm) | 6 | 11.2 |
| Fe (ppm) | 8.7 | 7.5 |
| Mn (ppm) | 5.8 | 10.8 |
| Zn (ppm) | 3.4 | 5.3 |
| pH | 7.2 | 7 |
| EC (dS/m) | 3.9 | 4.0 |
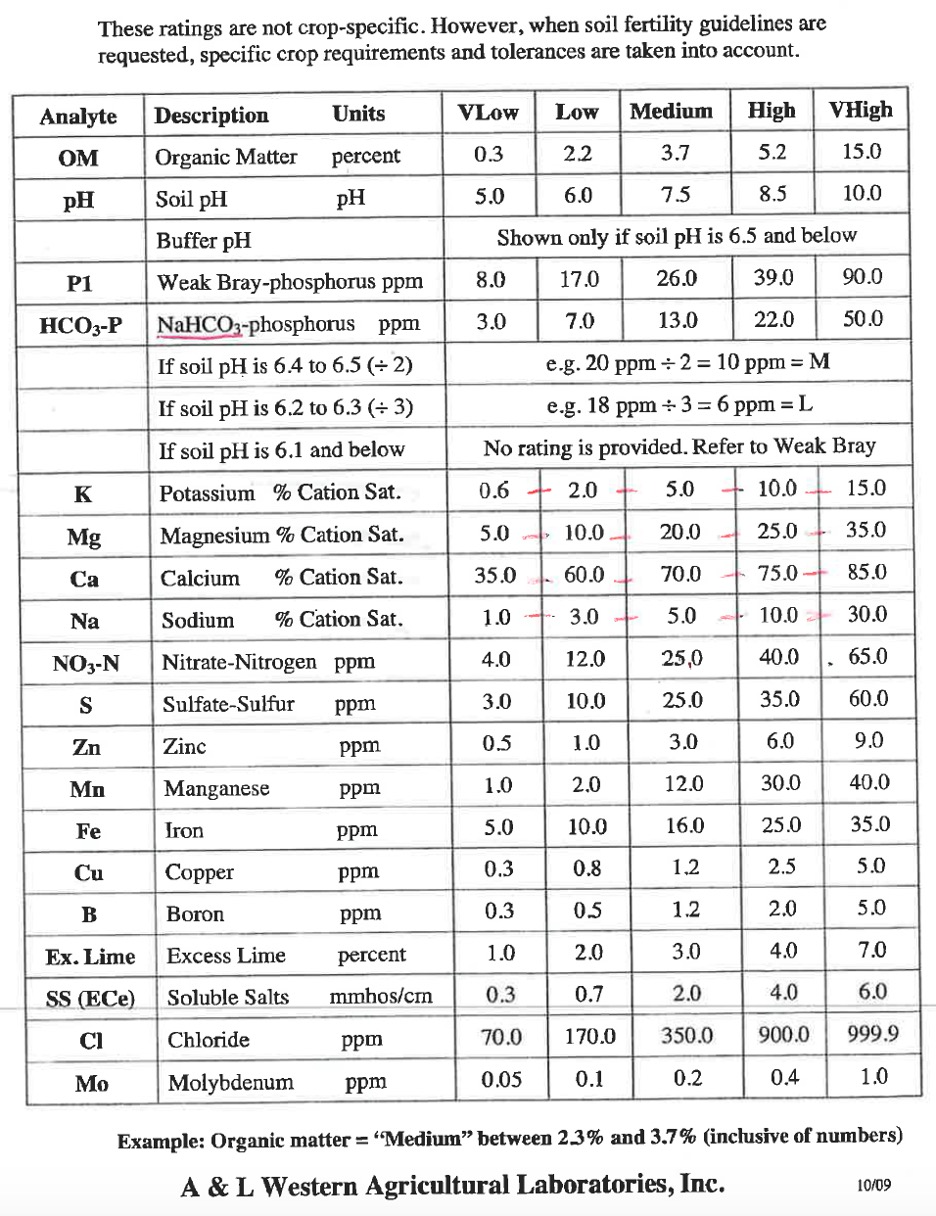
Use the guidelines below to guide the interpretation of your soil test report. Note, interpretation guidelines change as new research findings become available. The interpretation guidelines below are excepted from a document that used to be publicly available from the A&L laboratories website. Current interpretation guidelines used by commercial laboratories may have changed.
- Calculate the ESP for the tree and the tractor row in this soil. ESP is calculated as the concentration of Na in meq/100 g soil divided by the CEC. If you forgot how to convert from ppm to meq/100 g soil, you can find the info in lab 4.
- Calculate the Ca:Mg ratio for the tree and the tractor row in this soil. Don't forget to first convert Ca and Mg concentrations in ppm to Ca and Mg concentrations in meq/100g soil.
- Calculate the % saturation for Ca, Mg, and K. Show your work. If you forget how to do the calculations, refer back to lab 4.
- Compare and contrast the chemical soil health (i.e. information contained in the soil test report) in the tree row compared to the tractor row of the orchard, systematically following guidelines on how to interpret soil test reports from the stimulus (i.e., what is the general fertility potential of this soil, are there any issues related to pH, EC or sodicity, is there high risk for N or P pollution, are the basic cation concentrations balanced, which nutrients are high or low for your specific crop).
- Based on your interpretation of the chemical soil health of the orchard, are there any potential issues that currently exist or may come up that you will need to keep an eye on?
- Which solutions do you propose to manage potential issues that exist or may come up in the future, based on your answer to the previous question?
This activity is to be completed during the in-person lab activity
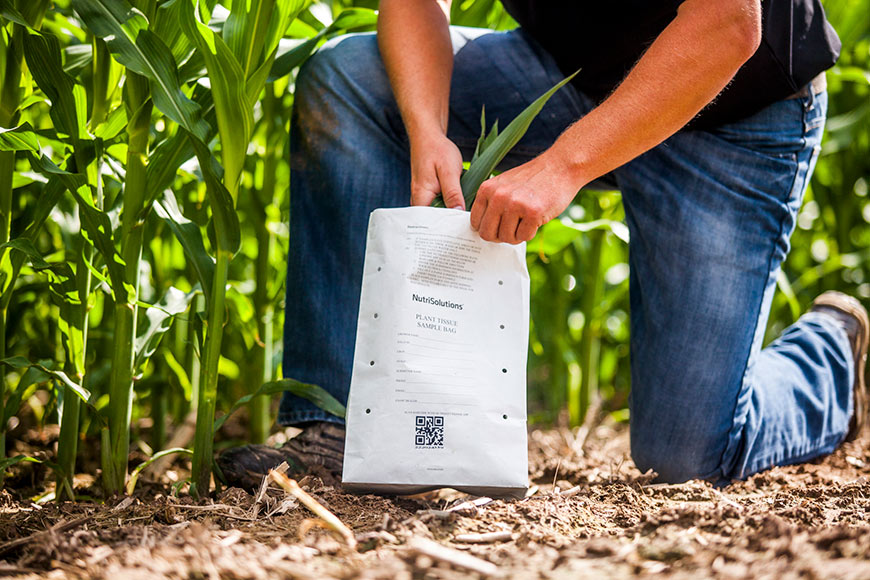
Image source: winfieldunited.com
Leaf tissue sampling procedures are crop specific. It is recommended to follow the guidelines provided by the testing lab for your particular crop. The fruit growers lab provides guidelines for tissue sampling of a variety of crops common in California. In this lab, we will practice taking leaf tissue samples following the guidelines for citrus provided by the fruit growers lab.
If the quarter you are taking SS 221 is not the right time to observe spring flush in citrus and practice leaf tissue sampling in the field, you can watch the video below to learn about what to pay attention to when sampling leaf tissue for citrus.
- According to the fruit growers lab, when should leaf tissue for citrus be collected?
- The fruit growers lab recommends that the sampler should traverse each sample area collecting samples perpendicularly or diagonally to the tree rows. Why can the sampler not collect all samples from the same row? Give examples of the types of biases that may be introduced if the sampler collected all samples from the same row.
- In your own words, describe how to select which leaves to sample, based on advice provided in the video
- Which bags should you use for leaf tissue collection for nutrient analysis? Why do you think the choice of bag matters?
This activity is to be completed during the in-person lab activity
Nutrient deficiencies can show visual symptoms on leaf tissue. These visual symptoms are quite well established for cereal crops, but may be expressed a bit differently in the many specialty crops we find in California. There are several apps to help you diagnose potential nutrient deficiencies in leaf tissue. In this lab, we will use the app nutrient technologies to test if we can identify any nutrient deficiencies in the lemon orchard.
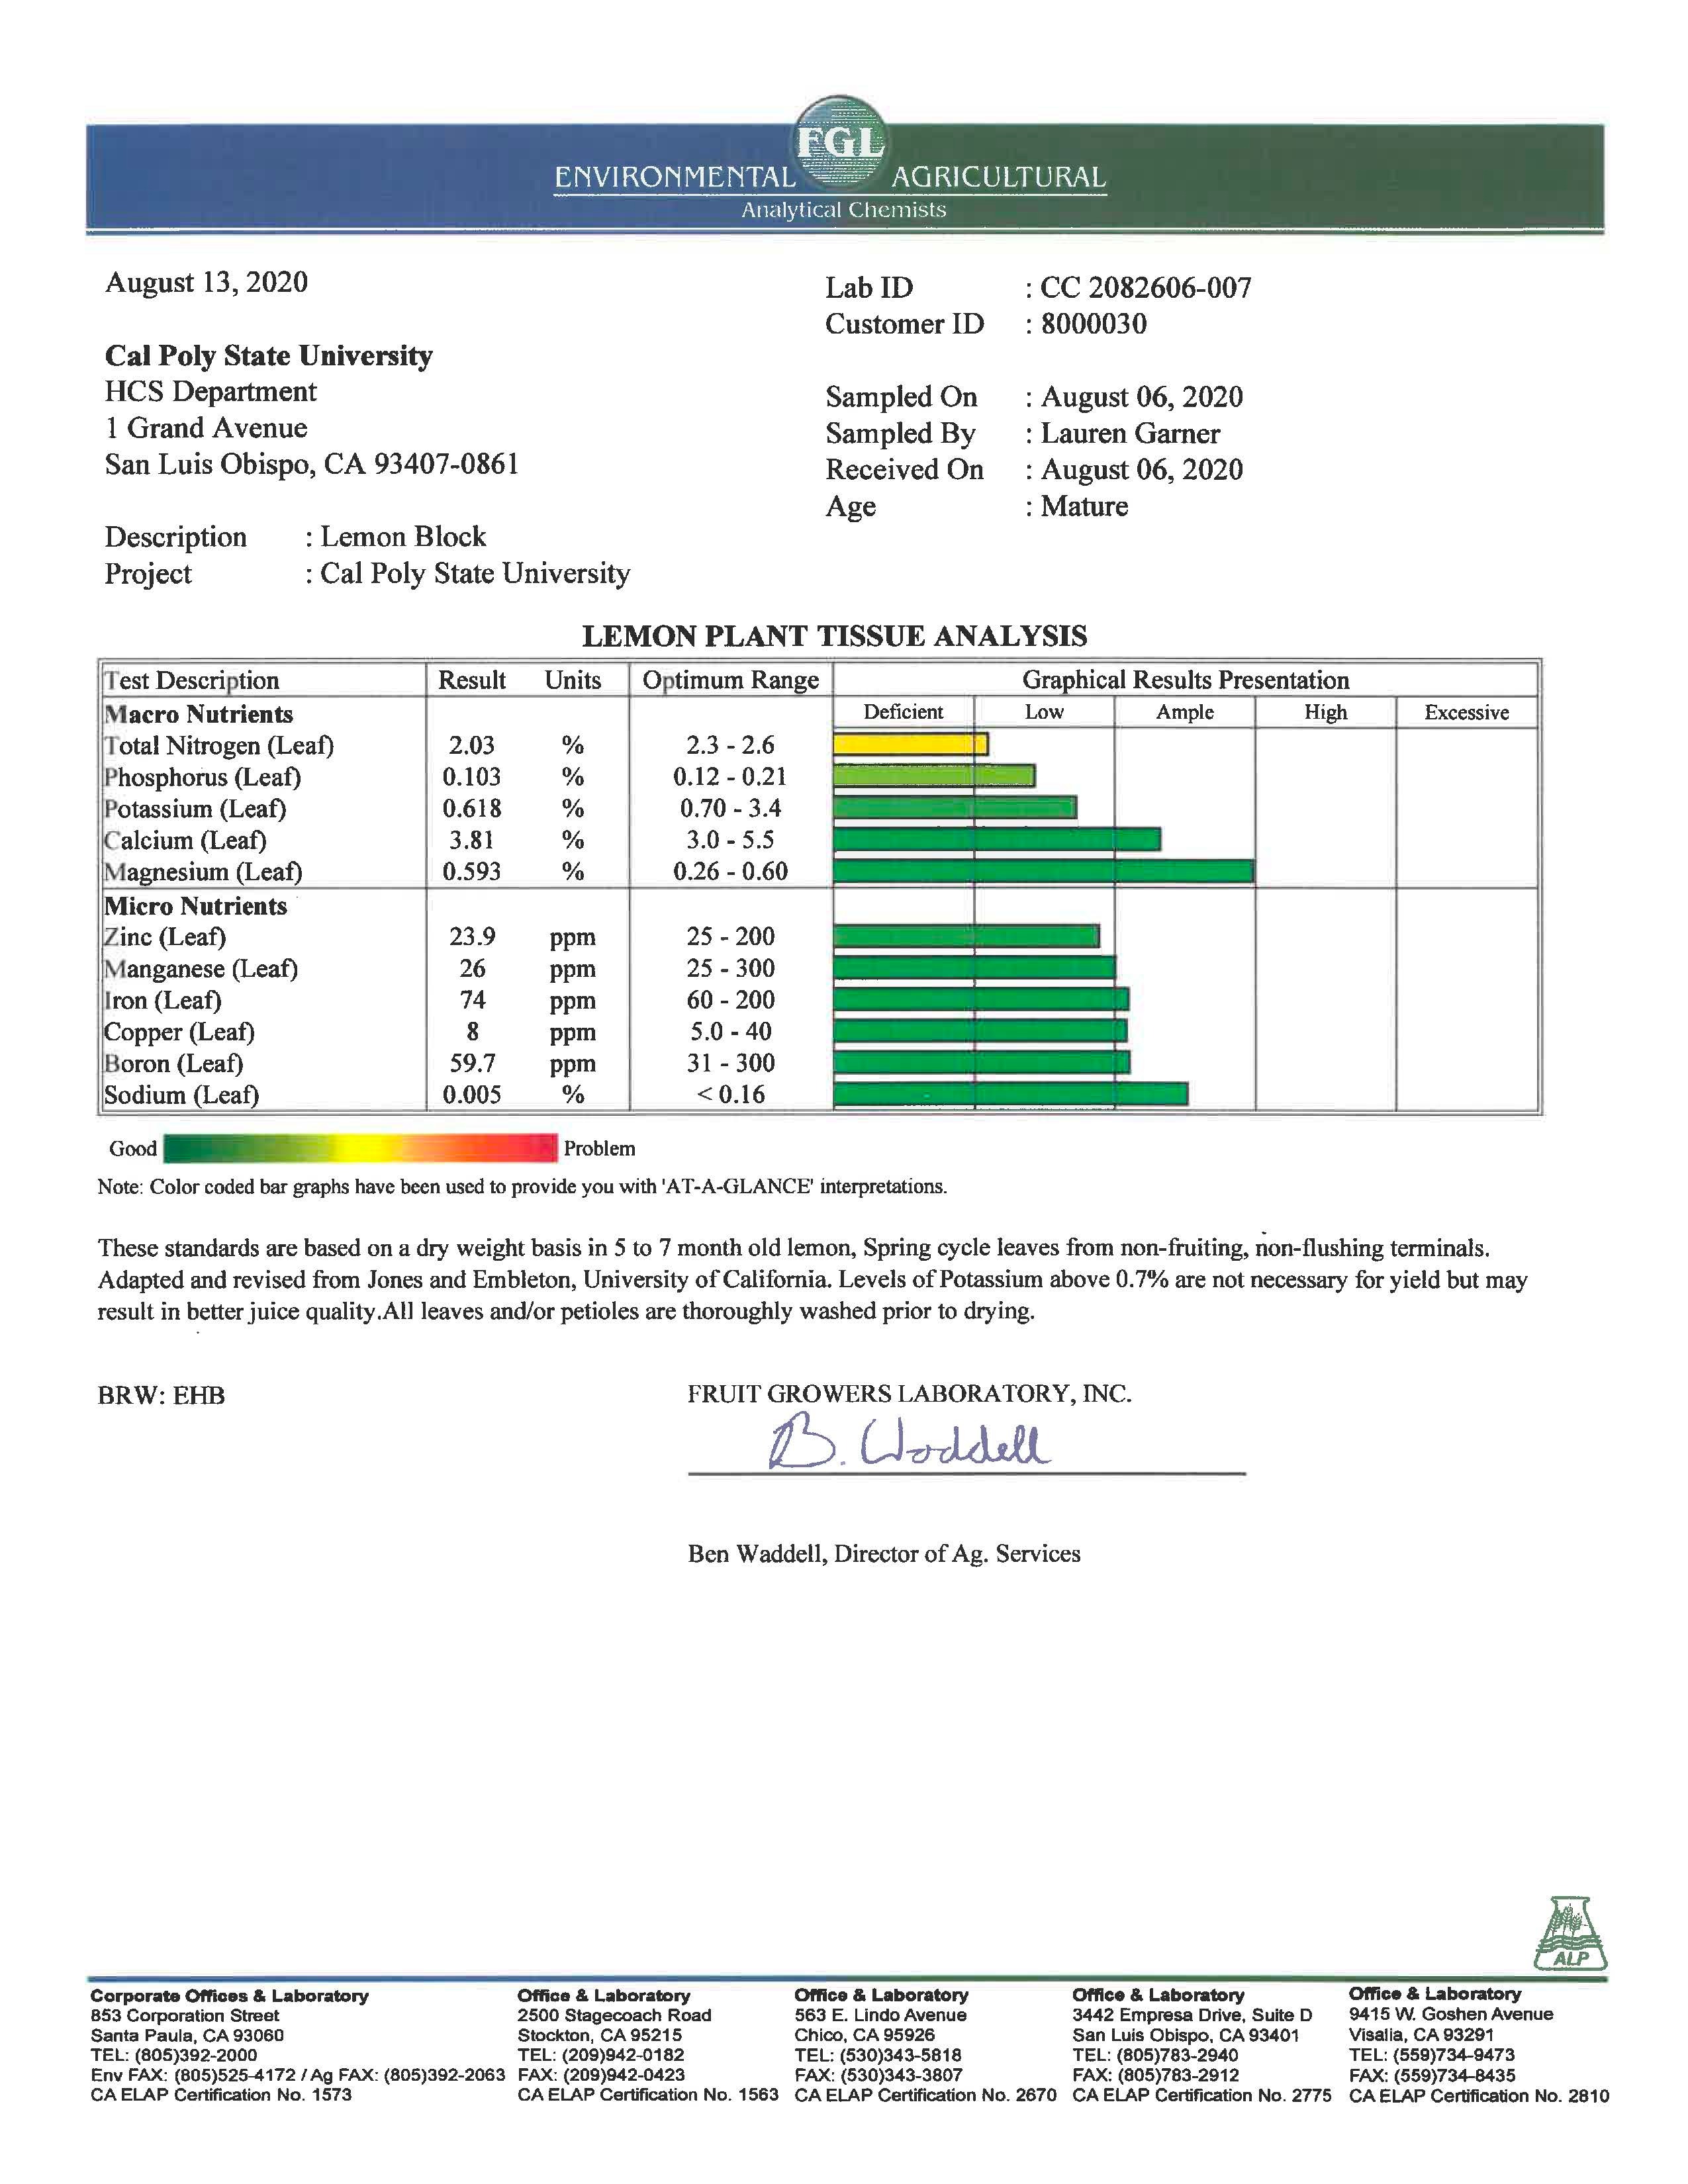
You will get a much more quantitative assessment of nutrient deficiencies when you send leaf tissue samples off for analysis. You leaf tissue test results from August 2020 are shown below.
- Compare your diagnosis of nutrient deficiencies in the lemon orchard based on visual symptoms using the nutrient technologies app vs results from the leaf tissue analysis.
- Discuss at least 3 challenges associated with using visual symptoms to diagnose nutrient deficiencies
- Compare and contrast what you learned from your soil test report with what you learned from your tissue test report.
- Based on your analysis of both the soil and tissue test results, what are some interventions you may propose?