Lab 8 Understanding N rates, a case study for lettuce
Lab 8 Understanding N rates, a case study for lettuce
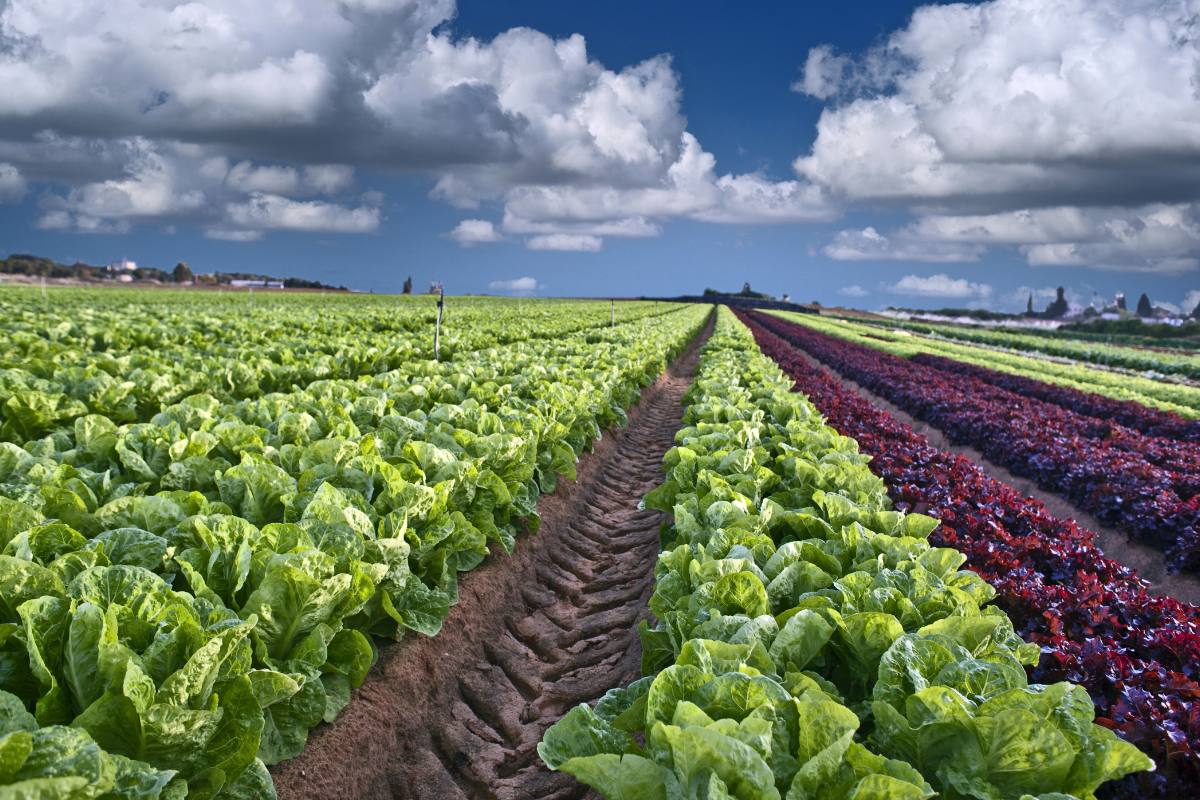
This quarter, we have focused on nutrient management in the Cal Poly lemon orchard. In today's lab, we will switch gears and focus on lettuce. Note that for tree crops and vines, there is a large focus on leaf tissue analysis for developing nutrient management plans. Soil samples are collected to diagnose potential issues with soil health and fertility. In annual crops, the soil tests form the basis of the nutrient management plan. You will be guided through determining nitrogen management for lettuce and discuss environmental regulations set by the state water board pertaining to nitrogen management.
In most states, cooperative extension services are responsible for conducting research and publishing fertilizer recommendations for major crops. In California, fertilizer recommendations for many major crops are conveniently summarized on the California Department of Food and Agriculture (CDFA) Fertilizer Guidelines website.
There is a wealth of information on the website, from how to take soil samples to links to specific studies on which fertilizer recommendations were based. For this virtual lab, we will take a closer look at the nitrogen fertilizer recommendations for lettuce.
When you click on the lettuce icon, you will be navigated to the fertilizer recommendations for lettuce. The information compiled on the website is restricted to recommendations for N, P and K. Carefully read through all the tabs pertaining to N. Then, inspect the attached soil test reports, and relate the information provided in the CDFA fertilizer recommendations to your case studies. Refer to last week's lab to refresh your memory on how to interpret soil test reports.
- What is the recommended sampling depth for NO3--N determination? Explain why!
- If you follow the CDFA fertilizer recommendations, would you apply preplant or starter N fertilizer if you grew lettuce on the Cal Poly campus field or the field at Chorro Creek Ranch. If so, how much N would you apply. Explain your answer!
- Regardless of soil type or soil test results, what should be the maximum total seasonal N application for Spring lettuce production?
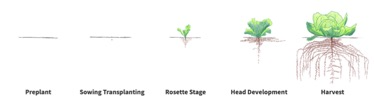
- Click on the 'Nitrogen Uptake and Partitioning' link on the left. What does the N uptake pattern over time look like? Draw the pattern with time on the X axis and crop N in lbs/acre on the Y axis, and upload the picture.
- When would you apply sidedress N? Distinguish between situations where preplant N was low, vs. when preplant N was high. You will have to read all information on the website carefully to answer this question.
- Imagine you collect leaf samples right before heading to assess if there might be a nitrogen deficiency in your field. Your test results come back, and the whole leaf tissue analysis shows 3% N. What would be your management response?
- How reliable is leaf tissue N to identify N deficiencies in the field?
There are many ways growers go about determining their fertilizer nitrogen input. Some growers just follow what the sales representative recommends, some growers follow recommended rates published by the cooperative extension, and some growers may apply nitrogen fertilizer based on previous experience and good past outcomes. However, due to the many environmental impacts associated with excessive fertilizer N inputs, governments and environmental groups worldwide are putting pressure on growers to reduce their fertilizer N input. The Certified Crop Advisors (CCA) propose a science-based approach to calculate N fertilizer input rates that meet crop requirements, while minimizing environmental impact. Here, we will walk through an example of how to calculate N rates based on CCA recommendations for the 2 soils for which reports were provided in the stimulus above.
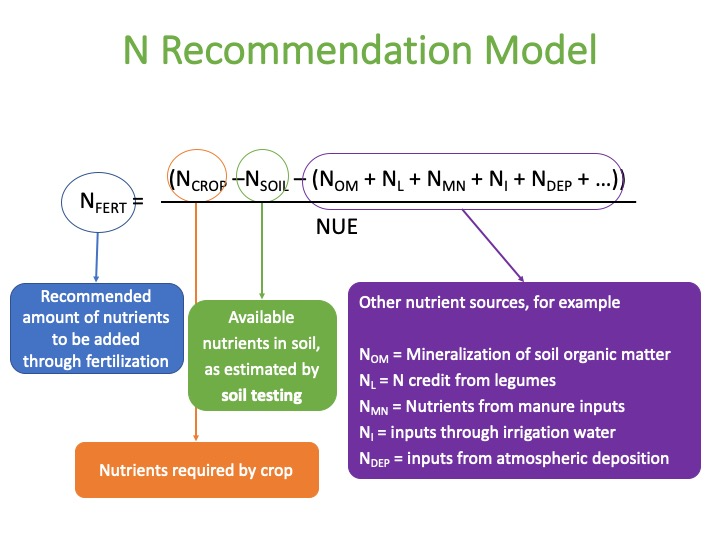
The N recommendation model starts with determining the amount of N required by the crop, meaning, the amount of N the crop is actually going to take up. Next, You subtract all N sources that are already available in the plant soil system, including residual NO3--N as indicated by the soil test report, N mineralized from soil organic matter, N from legumes, N from manure inputs, N from irrigation water, N from N deposition, etc. In practice, most growers have, at best, only information about residual NO3--N as indicated by the soil test report. We will learn that growers will be required to take into account N inadvertently applied through irrigation water in their N management and reporting under Ag. Order 4.0. It is to be expected that accounting for as many N sources as possible will become increasing important as regulation tightens. After subtracting all N sources already available in the soil-plant system from the crop N requirement, you divide by the nitrogen use efficiency (NUE). Given how dynamic N is in the soil, it is almost unavoidable that some of the N applied as fertilizer will be lost or move into N pools other than the plant. As a global average, N use efficiencies sit around 50%, meaning that on average, only 50% of fertilizer N applied is taken up by the crop. Under best management practices, it is conceivable to attain NUEs of 75%.
Calculation example:
You are growing strawberries, and expect they will take up 250 lbs N/acre. Your residual soil NO3--N levels are 30 ppm, based on a sample taken to a depth of 1 foot. You expect to achieve a NUE of 70%. What is the recommended N rate, based on the N recommendation model?
First, you'll need to convert from ppm NO3--N to lbs NO3--N/acre.
You assume there is 4 000 000 lbs of soil/AF.
Therefore,
residual NO3--N = 30 x 4 = 120 lbs N/acre
Nrec = (250 - 120)/0.70 = 186 lbs N/acre
You already know how to take a soil sample for testing residual NO3--N levels. Another important factor in the N recommendation model is the crop N requirement, meaning the amount of N the crop is expected to take up in lbs N/acre. With all the different numbers and rates listed on the CDFA fertilizer guidelines, how do you know which number to use? Well, the first step is to figure out your expected yield. The amount of nutrients your crop will need depends first and foremost and how much biomass is typically produced. Next, you need to find out how much N is taken up or removed by harvest per unit yield. For lettuce, the whole plant is harvested, so the amount of N taken up by the plant and removed by harvest is the same. Once you know your expected yield in lbs crop/acre and your N uptake in pounds N/lbs crop, you can determine your crop N requirement in lbs N/acre by multiplying the expected yield with the N uptake.
Note, the N recommendation model only applies to N rates. We use other concepts and strategies to determine P and K rates.
- Read the 'Lettuce production in California' information by clicking on the link on the left sidebar on the CDFA fertilizer guidelines for lettuce page. What was the typical (average) yield for romaine lettuce in lbs/acre, for the last decade. Note, in the United States, a hundredweight is a unit of mass equal to 100 pounds
- What is the mean amount of N removed by harvest in Romaine lettuce in Salinas, in lbs N/lbs fresh lettuce? The information can be found in the 'Lettuce N Uptake and Partitioning' report.
- Using your answers from the 2 previous questions, what is the expected mean N requirement for Romaine lettuce in Salinas, CA. Show your work!
- Assume you are growing romaine lettuce, and expect your yield to reflect the average yield in California in the last decade. You have soil NO3--N test results, but no data on other potential N sources. Therefore, you assume other N sources are 0 lbs N/acre. You assume you will achieve a NUE of 60%. You also assume that N removal rates in San Luis Obispo County are similar to those in Salinas, CA. Calculate the recommended fertilizer N rate for the Cal Poly campus field and the Chorro Creek Ranch field, assuming that the NO3- levels on the soil test report represent NO3- in the top foot of soil, and you expect lettuce roots to grow about 1 foot deep. Assume that 1 acre-foot of soil weighs 4 000 000 lbs. Show your work!
- Based on what you learned from the CDFA fertilizer guidelines and applying the N recommendation model, propose how much N you will apply per acre in the Cal Poly Campus field and the Chorro Creek Ranch field, at each plant developmental stage. You may notice that it can be challenging to reconcile outcomes from the N recommendation model with general CDFA fertilizer guidelines. Use critical thinking to propose a fertilizer strategy in each field, justifying how you used the information from the CDFA fertilizer guidelines and the N recommendation model to develop your management plan.
California agriculture is extremely diverse and spans a wide array of growing conditions from northern to southern California. As we have learned in this course, water discharges from agricultural operations in California include irrigation runoff, flows from tile drains, leaching losses to the groundwater, and storm water runoff. These discharges can affect water quality by transporting pollutants, including pesticides, sediment, nutrients, salts (including selenium and boron), pathogens, and heavy metals, from cultivated fields into surface waters. Many surface water bodies are impaired because of pollutants from agricultural sources. Groundwater bodies have suffered pesticide, nitrate, and salt contamination.
To prevent agricultural discharges from impairing the waters that receive these discharges, the Irrigated Lands Regulatory Program (ILRP), overseen by the State Water Resources Control Board, regulates discharges from irrigated agricultural lands. The development and implementation of specific orders that meet water quality targets falls on the shoulders of the regional water quality control boards. Growers are required to follow regulations included in the order for the region in which their field is located. There are 9 water quality control regions in California.
- North Coast Region
- San Francisco Bay Region
- Central Coast Region
- Los Angeles Region
- Central Valley Region
- Lahontan Region
- Colorado River Region
- Santa Ana Region
- San Diego Region
In this class, we will take a closer look at some of the regulations proposed in the upcoming Agricultural Order (Ag. Order) 4.0 in the Central Coast Region. Note that regulations and reporting requirements may vary from region to region. In the Central Coast Region, the current Ag. Order 3.0 has expired, and a Draft General Waste Discharge Requirements for Discharges from Irrigated Lands, referred to as Ag. Order 4.0, was open for public comment until 20 June 2020. Take a look at the draft Ag. Order 4.0 and answer the questions on the right.
- List all N sources that need to be included in a total N applied report.
- Dischargers have the option of using a compost discount factor (C) to calculate the amount of compost nitrogen mineralized during the report year the compost was applied to the ranch. Which discount factor is proposed for compost with a C:N ratio over 11, and what does it mean?
- In your own words, describe what discharge limit is, and how it works.
- Following in guidelines in the draft Ag. Order, calculate RHARV for Barley, assuming that you harvest the grain, and the yield is 2.5 tons/acre. Show your work!
There are many tools researchers use to develop fertilizer recommendations. One of these tools is the N rate trial. By growing a crop at different N rates and tracking the yield across this N rate gradient, the point beyond which additional N does no longer improve yield can be identified. At lower N rates, yield is expected to increase linearly with increasing N rate. At higher N rates, yield is expected to reach a plateau. The point where the plateau starts is referred to as the optimal N rate.
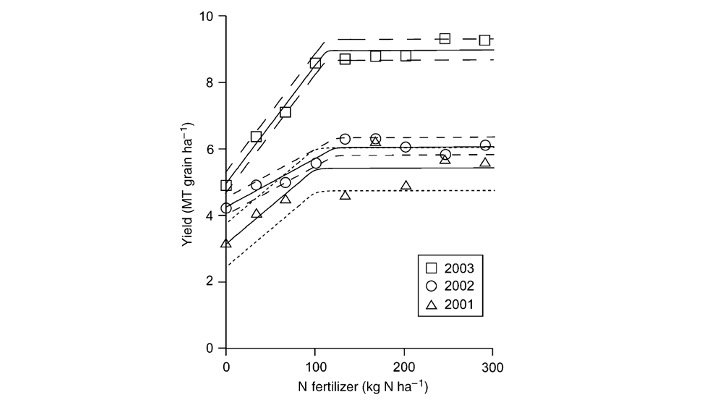
Figure: Example of N-rate curve for corn. Corn grain yield across the N addition gradient for 2001, 2002, and 2003. Dashed lines represent standard error. From McSwiney and Robertson, Global Change Biology (2005) 11, 1712–1719, doi: 10.1111/j.1365-2486.2005.01040.x
In this virtual lab activity, you will analyze a dataset from a greenhouse experiment where the effect of N rate on lettuce growth was tested in two soils, each with versus without soil amendment. The experiment was set up in a greenhouse at Cal Poly. Romaine lettuce seedlings were grown from seed for 30 days and transplanted at the beginning of the quarter in 6" clay pots; 1 transplant per pot. Each pot was considered an experimental unit. Lettuce was harvested after 7 weeks of growth.
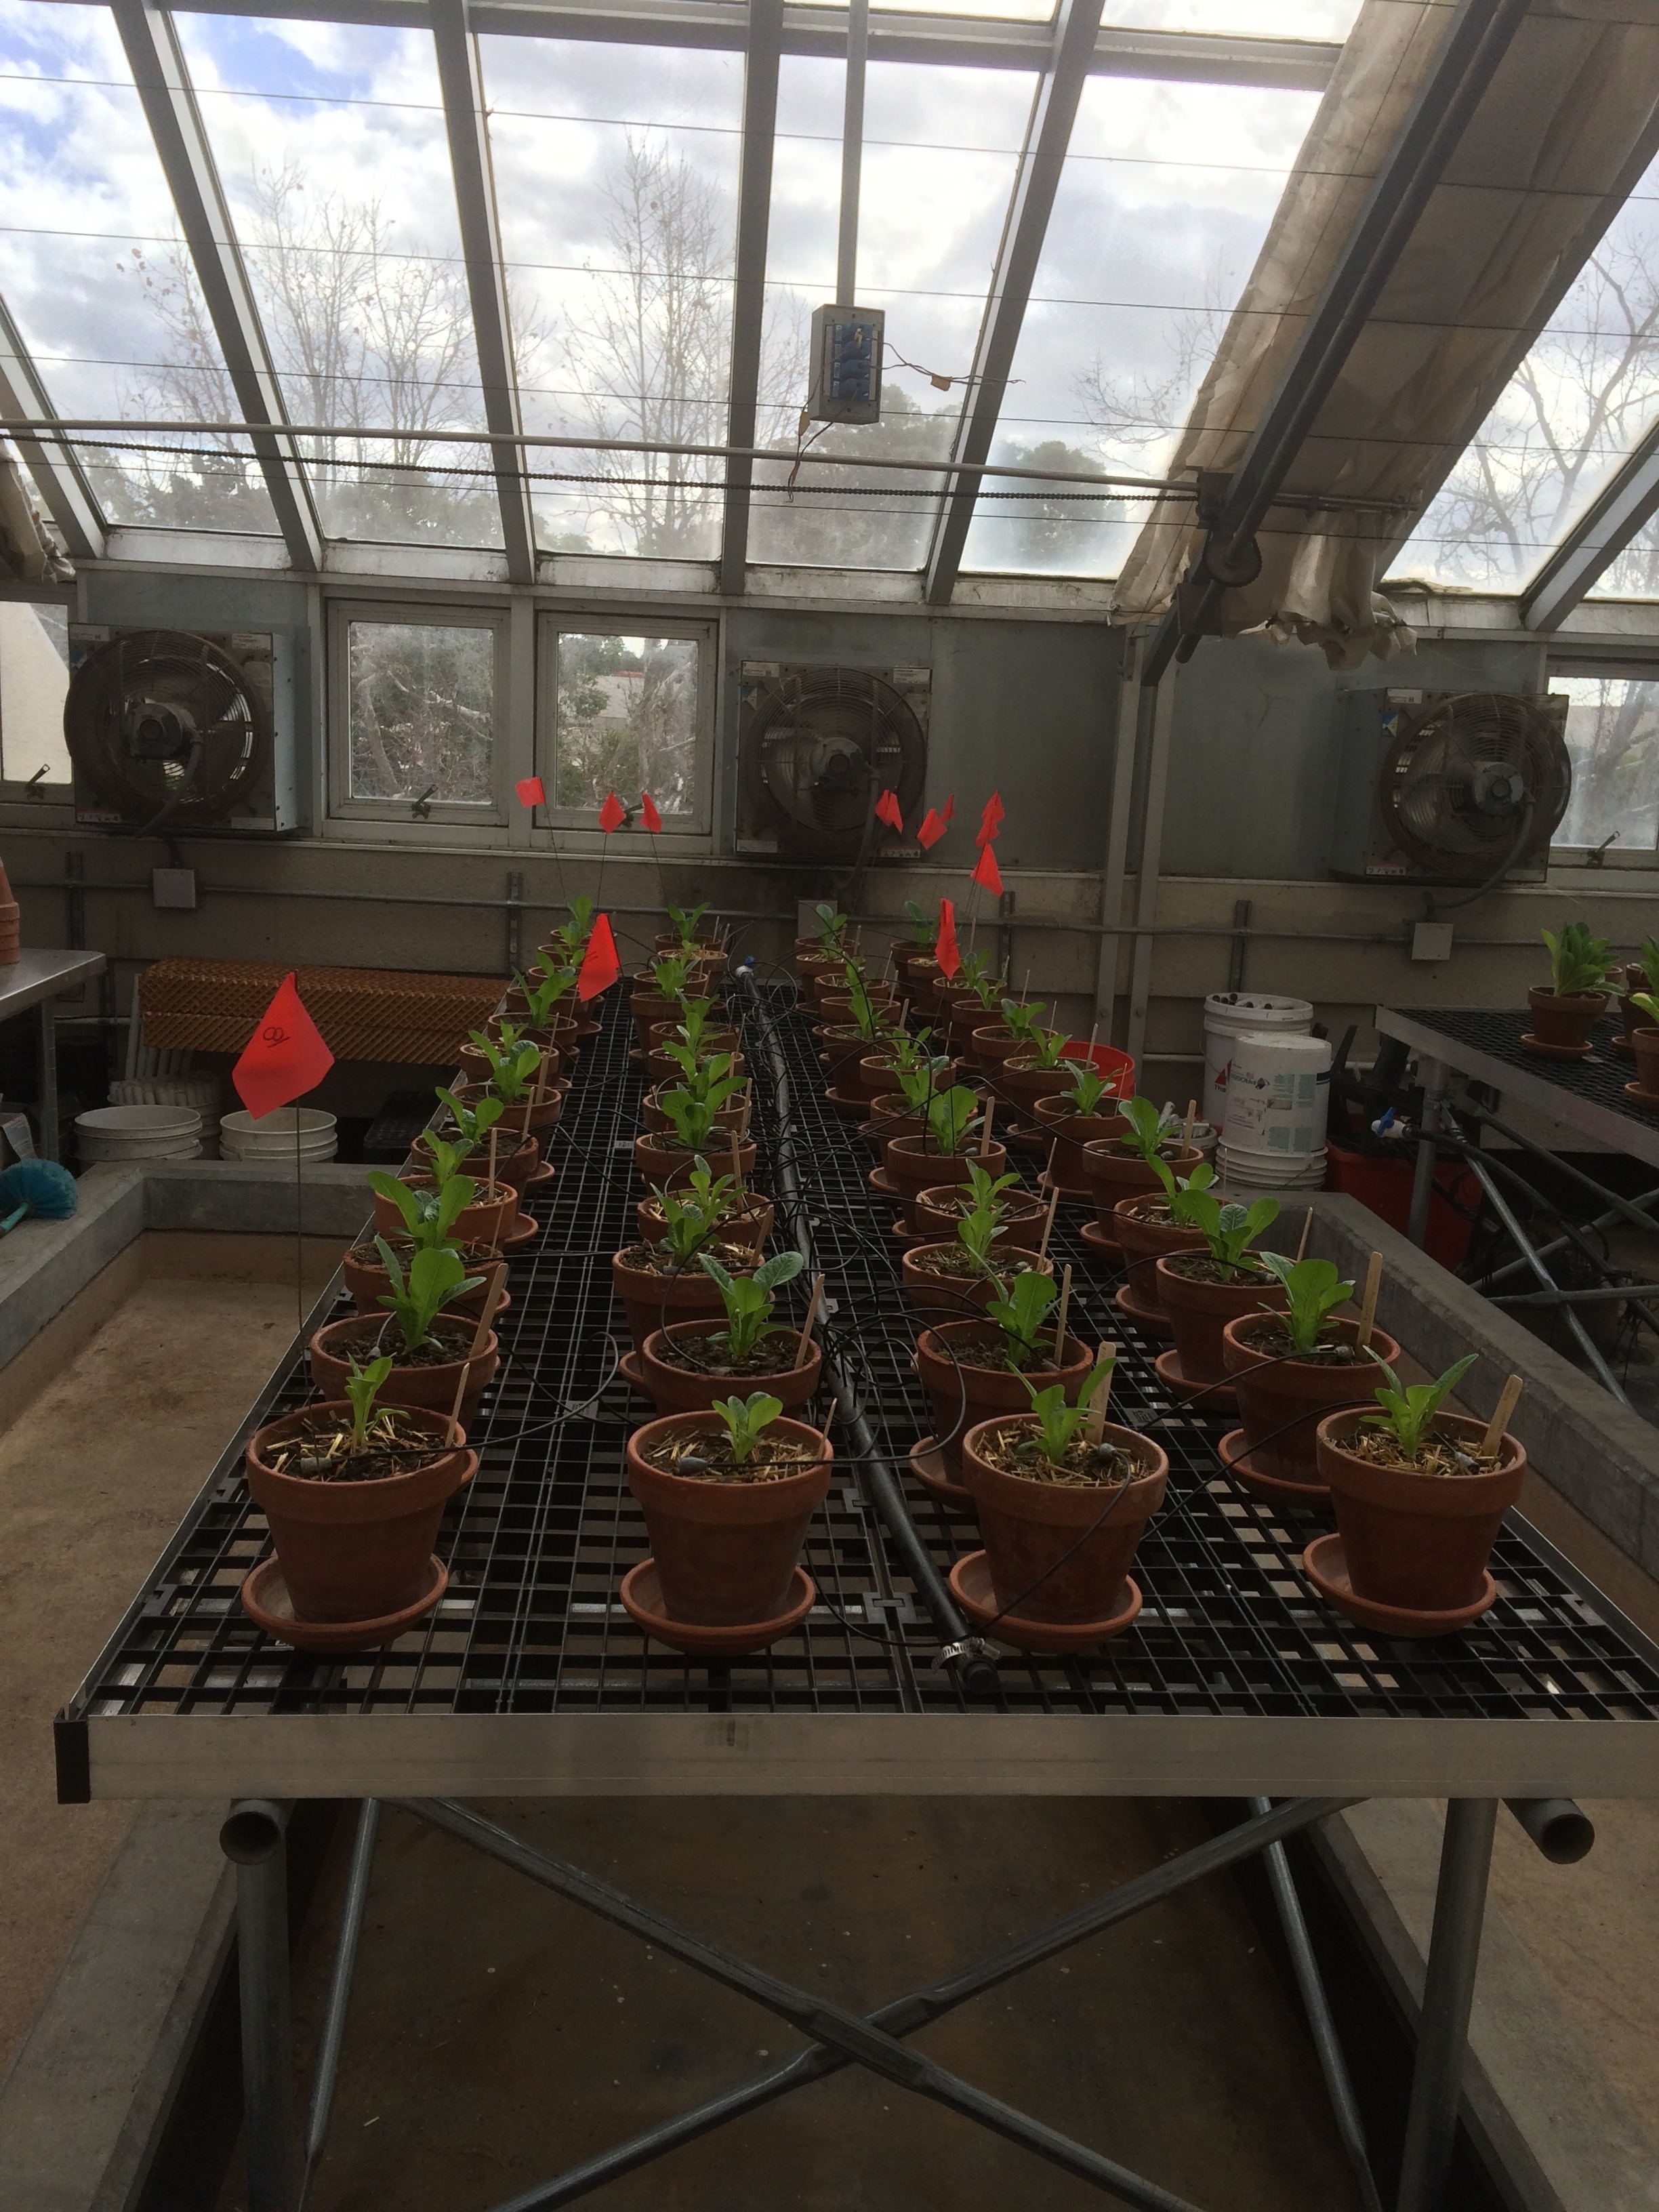
As such, the experiment was set up as a randomized complete block design with 3 factors: N rate, soil type, and organic input.
- N rate had 4 levels: 0, 50, 100 and 150 lbs N/acre. N was added to each pot as urea-N.
- Soil type had 2 levels: Cal Poly Campus Soil and Chorro Creek Ranch Soil. These are the soils for which you received soil test report in the first stimulus of this lab.
- Organic input had 2 levels, straw amendment, and no straw amended. The straw amendment simulate incorporation of a crop residue with high C:N ratio prior to planting lettuce.
Each treatment combination was replicated 3 times, for a total of 48 pots. Note, the level of replication in this experiment is low, and may limit the capacity to find statistically significant differences. The level of replication was chosen to be feasible within the context of a class laboratory.
Follow the link to find the data collected in this experiment. Disclaimer, the data was modified and manipulated to support learning outcomes for this assignment. Therefore, results from this assignment should not be generalized or shared. Download the spreadsheet. You will find data for several response variables in the spreadsheet:
- lettuce height: Lettuce height is the height of lettuce at harvest, in inches. Lettuce size is one of the metrics in the USDA inspection guidelines for romaine lettuce.
- lettuce fresh weight: Fresh weight is relevant as an indicator of yield
- lettuce dry weight: Dry weight is often used by scientists because the data is more robust and closely linked to net primary production.
- %N in leaf tissue: %N can be interpreted as is, and compared to the N sufficiency levels as discussed in the CDFA fertilizer guideline section of this assignment. %N is an indicator of whether the crop may be experiencing N deficiencies.
Using the data provided in the spreadsheet, additional response variables can be calculated, including:
- yield in lbs lettuce/acre
- plant N uptake, in lbs N/acre
Yield in lbs lettuce/acre can be calculated as follows (units are in square brackets [ ] ):
Yield [lbs/acre] = Fresh biomass [g lettuce/pot] x 0.0022 [lb/g] / 4.5e-6 [acre/pot]
Note, we are using 6” clay pots. The surface area of the pot, in acres, equals
(6 in/2)2 x pi / (1.59423e-7 in2/acre) = 4.5e-6 acre/pot
Plant N uptake in lbs N/acre can be calculated as follows:
Plant N uptake [g N/pot] = Dry biomass [g N/pot] * Nitrogen concentration [%]/100
Then,
Plant N uptake [lbs N/acre] = Plant N uptake [g N/pot] x 0.0022 [lb/g] / 4.5e-6 [acre/pot]
Note, in the case of lettuce, all aboveground biomass is harvested. Therefore, the plant N uptake equals the removal rate by harvest (RHARV), which was proposed as a metric required to be reported under the upcoming Ag. Order 4.0.
Calculate the plant N uptake, following the instructions in this stimulus, for all the observations in the experiment. You can add a column to your spreadsheet and plug the equation in for the first observation. Then, drag the equation down for all the other observations in the spreadsheet.
Once you have calculated the plant N uptake, in lbs/acre, summarize and visualize the response variables as shown in the video.
Following the guidelines in the video, make charts for to visualize averages and standard errors for the response variables
- Lettuce height in inches
- Yield in lbs/acre
- Lettuce dry weight in g/pot
- %N
- N uptake in lbs N/acre
Create a separate sheet (tab) within your workbook for each response variable.
If you do not already have Microsoft Office on your personal computer, you can download a license from Cal Poly. The pivot tables and chart tools work best on a desktop version of Microsoft Office. Google sheets and One Drive Microsoft Office have limited capabilities.
Interpret data from the N rate trial in light of CDFA fertilizer recommendations, agronomic optimums, and Ag. Order 4.0.
The questions below will point you in the direction of important patterns to pay attention to in the data. As you are looking at the data, please follow these rules of thumb:
- As scientists, we would not want to draw conclusions from the data without performing a statistical analysis. Statistical analysis is beyond the scope of this class. However, the standard errors give you some guidance on the likelihood of statistically significant differences between treatments. If the standard errors overlap, there is very little chance of detecting a significant difference between treatments. In that case, any apparent differences between the means are due to random variability.
- To explain differences or the lack thereof in response variables between the 2 soils, go back to the soil test reports to help explain the observed patterns.
- To explain any effects of straw amendment on the response variables, you need to use your understanding of the N cycle. Remember, straw is an organic input with a high C:N ratio. When organic materials with a high C:N ratio are added to the soil, we learned that microorganisms will immobilize plant available N. Let's elaborate a bit on this topic!
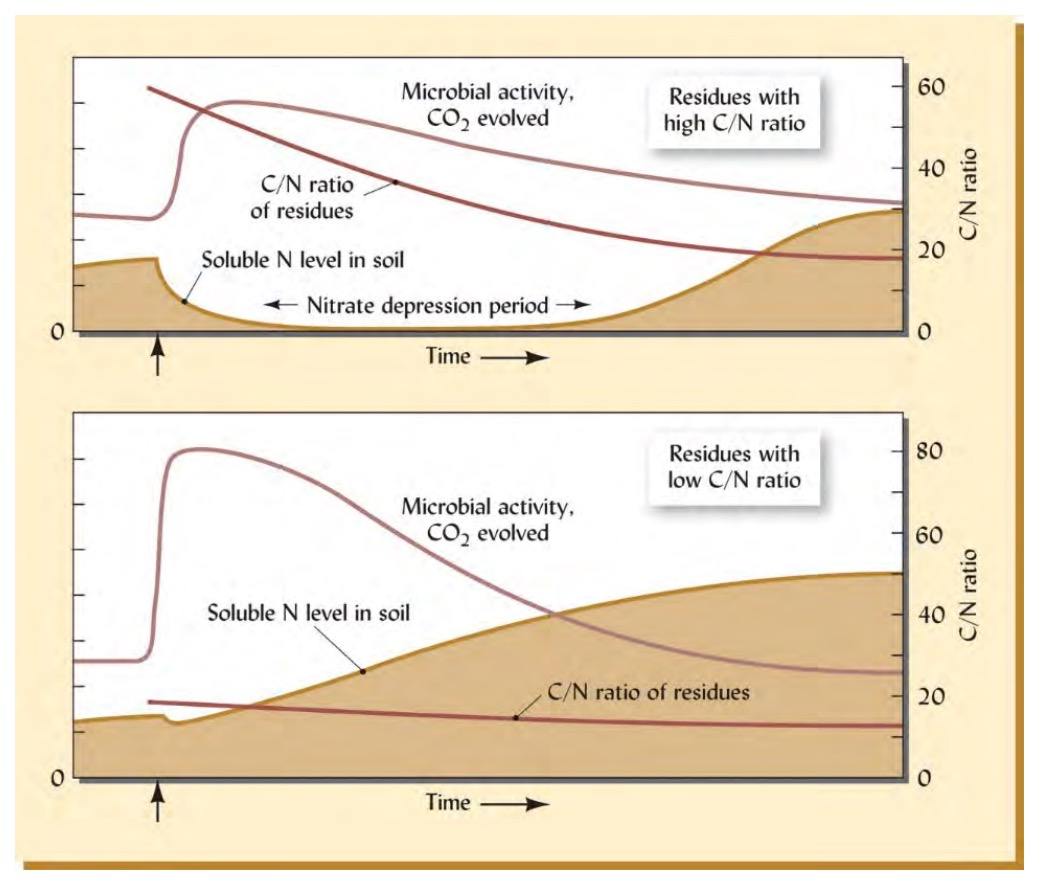
The figure above is excerpted from the Brady and Weil textbook you used in SS 121/120. It shows changes in microbial activity, plant available N, and the residual C:N ratio of the organic input following the addition of a high vs. low C:N ratio organic material. Where the C:N ratio of the added residues is above 25, microbes digesting the residues must supplement the nitrogen contained in the residues with soluble nitrogen from the soil. During the resulting nitrate depression period, competition between higher plant and microbes would be severe enough to cause nitrogen deficiency in the plants. Note that in both cases plant available N in the soil ultimately increases from its original level once the decomposition process has run its course. The trends shown are for soils without growing plants, which, if present, would continually remove a portion of the soluble nitrogen as soon as it is released. (Diagram courtesy of R. Weil).
- Once you have summarized and created graphs for each of the response variables (lettuce height, fresh biomass, dry biomass, %N, N uptake in lbs N/acre), upload your Microsoft Excel file here. Make sure your charts have axis titles with correct units, a chart title, a legend and error bars representing standard errors.
- Based on your N rate trial, what appears to be the agronomically optimal N rate, meaning, the lowest N rate required to maximize yield. Does the optimum rate differ between the 2 soils, or change with straw amendment. If so, what do you think is the reason. Look at the soil test reports to support your answer.
- Did the tissue leaf N concentrations provided suggest any N deficiencies? Explain! (Hint, go back to the CDFA guidelines for reference N concentrations in lettuce tissue).
- How does the plant N uptake in lbs N/acre compare to the N fertilizer input rates in lbs N/acre? Does the plant generally take up more or less N than the amount of N applied? Do you see effects of straw amendment or soil on plant N uptake?
- How does the plant N uptake data in this experiment compare to the plant N requirement calculated for lettuce in the section 'Fertilizer rate calculations'? If you see differences, what may be the causes?
- Given the information regarding the effect of organic inputs on plant available N over time, what recommendations would you give a grower who is planning on growing lettuce following wheat?
- If the patterns in this experiment were repeated in several field trials, how could the results of this experiment inform CDFA fertilizer guidelines for lettuce?
- If the patterns in this experiment were repeated in several field trials, how could the results of this experiment inform discharge limits for Ag. Order 4.0?
- Throughout this assignment, you may have noticed that there are a lot of pieces to the puzzle of optimizing N fertilizer rates, and that there are a lot variables that affect what may be the best N rate for a particular situation. Formulate your take-home message from this assignment, looking into the future.