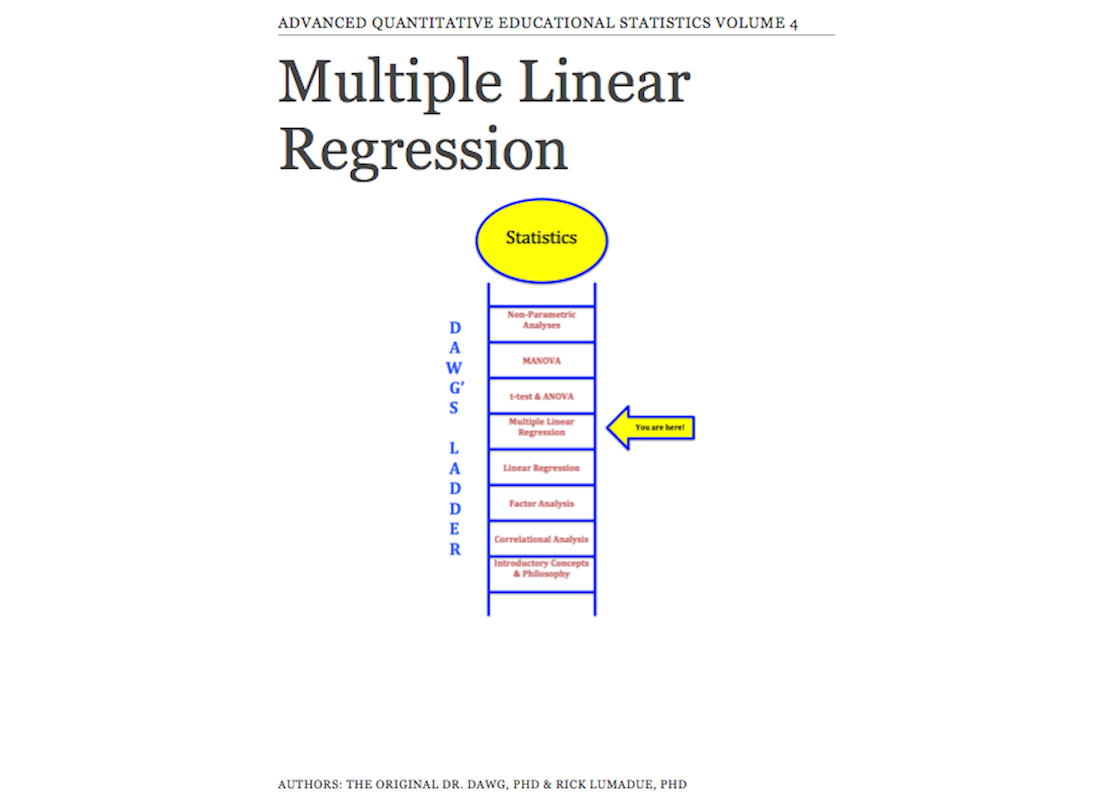
Multiple Linear Regression

The fourth volume in a series of Advanced Educational Statistics, Multiple Linear Regression builds on the innovative teaching methodology for learning educational statistics. A narrative, along with videos, output data sets and sample data sets are included. As with previous volumes in the series, the video presentations are the focal point and will be especially helpful for guiding the learner through the process of conducting statistical analyses using SPSS and interpreting SPSS output data.
Would you have ever envisioned yourself mastering this much statistics? You are coming to the place where another concept is no problem at all! Let's meet multiple linear regression. Multiple linear regression is about using independent variables to model or predict a dependent variable. Many researchers will say that the independent variables explain variance in the dependent variable. This is certainly an acceptable way to look at modeling or prediction. All upper statistics if founded upon the mean and the variance. Correlation is about the study of mean and variance. Since regression is founded on correlation, regression is about variance. We can absolutely say that multiple linear regression is about how much variance each independent variable explains in the dependent variable. The video should help clarify this opinion.
Multiple linear regression is founded upon several assumptions. These are discussed in the video. As with all quantitative research, the assumptions are important. If assumptions are not met, the researcher is obligated to declare such to the reader. The goal is that the informed reader will then know how to interpret the results of the study.
Multiple linear regression is founded in correlational research. As such, the research questions will sound much like the research questions of a correlational study. The video will explain this process in more detail.
As with each topic covered in this course, the time has come to examine the utilization of SPSS to conduct our analyses. For this project, we will utilize the same data set that was used in our factor analysis problem. Consider the following video below.
Our last great challenge is to interpret the SPSS readout for our multiple linear regression model. To complete our problem, we must identify the tables and information appropriate to our measuring both initial assumptions and findings for our study. Observe the video below.